Total Yardage vs. Yards Per Play
Watching college football on any given Saturday, it becomes quite clear how much variation there is from one offense to another. Some teams prefer to slow the game down, get in big and condensed formations, and lean on the opponent over the course of the game while simultaneously dictating game flow. Others choose to spread out the defense and stress defenders both horizontally and vertically, electing for a “basketball-on-grass” style of offense while going as fast as possible. Many teams mix in elements of both of these styles to create a unique identity that plays to both their players’ and their coaches’ strengths.
Naturally, this wide variation in styles between offenses can make comparisons difficult. Traditionally, fans and media use metrics such as total yards per game, points per game, and turnovers per game to evaluate an offense’s effectiveness. With such great variations in tempo (and resultingly, plays per game), these metrics are a starting point at best. Efficiency-based metrics have started to make their way into mainstream media coverage, but far too often, I still see teams lauded (or shamed) for their total yardage rankings, rather than something that is more indicative of their down-to-down ability.
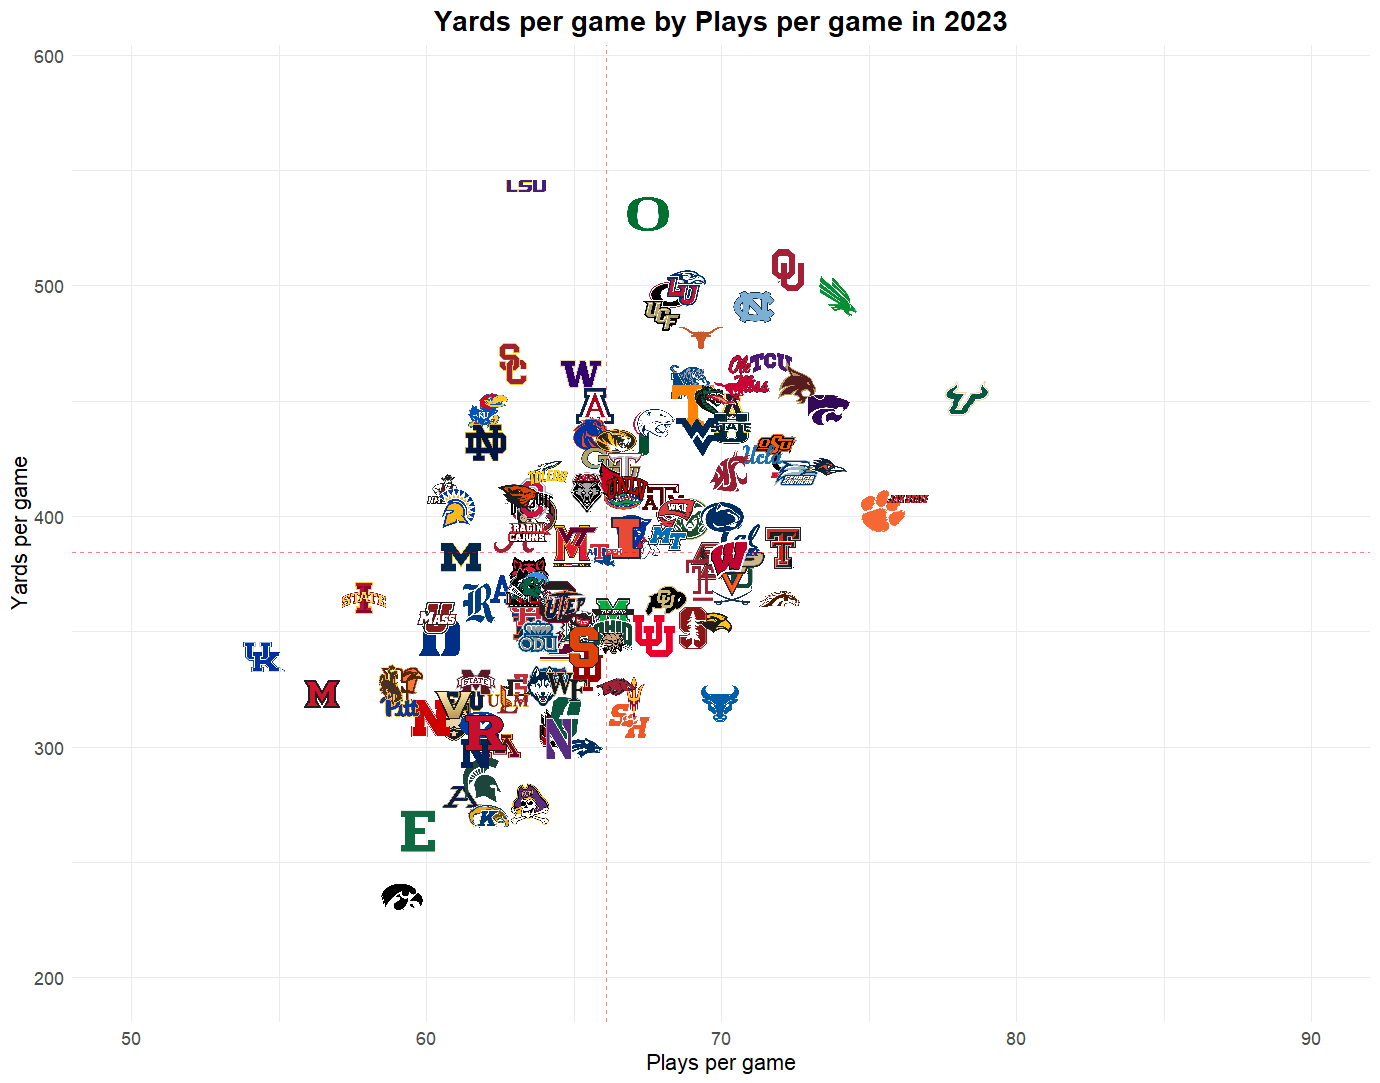
Yards per play largely solves this problem. It’s simple enough to understand but also accounts for the wide variety in the number of plays an offense may run. Below is a scatterplot that visualizes how yards per play achieves this, by plotting yards per game by plays per game, using the most recent full season of data available:
[Power Five only graph]

Most teams follow a general trend, with Louisiana Tech apparently having the most “average” offense in 2023. One thing essential to interpreting this graph is to understand what the four quadrants, defined by the red average lines, actually mean. Teams in the top right and bottom left quadrants are sort of1 doing the same things from an efficiency standpoint. If you’re in the top right, you run more plays and gain more yards than the average team over a whole game and vice versa for the bottom left. This means there is generally a consistent yards per play range as you travel between these two columns, looking something like this:

This is borne out by teams in the clump toward the middle. Kansas State and Rice are within 0.19 YPP of each other, yet Kansas State averages over 80 more yards per game. The answer? Kansas State is running roughly 12 more plays per game. Down-to-down, these offenses achieve the same thing in the box score. Yet by the traditional metric of YPG, Kansas State is 23rd while Rice is over 60 spots lower at 84th.
The upper left quadrant represents the super-efficient/explosive offenses. These are teams that ran less plays per game than the average team while still yielding more yards per game. It’s no surprise to see teams like LSU, USC, and Washington in this quadrant.2 In the bottom right are the extremely inefficient teams, who ran more plays than average, but still yielded less yards than the average YPG. These were some of the worst teams in the FBS, and if they weren’t, they had a pretty good defense (looking at Utah).
Two things worth noting: First, these quadrants can be somewhat self-fulfilling. For example, a team that gains fewer yards is likely to punt more often, resulting in fewer plays. Meanwhile, an offense that is able to consistently go on 10-play drives and accumulate yardage is going to have a higher play count. Because of this, teams naturally gravitate toward the bottom left and upper right quadrants. Those in the top left and bottom right quadrants lie outside the norm.
Second, the upper left and bottom right quadrants represent the best and the worst, but as long as you’re comfortably above the linear trend, you’re averaging a high YPP for the number of plays you run. Oregon is technically not in the super-efficient quadrant, but they are still averaging 2 more yards per play than the rudimentary model predicts (7.87 actual vs 5.86 predicted). I singled out the quadrants because they’re both easier to understand and represent the extremes, but, as proven by Oregon, an offense living well above the blue line is doing well.
Third, plays per game is 100% influenced by a team’s defense. Further, it’s not just a matter of whether your defense is effective or not. If your defense is prone to getting ball-controlled, adapting a “bend-but-don’t-break” mentality, this will tangibly result in less plays run by your offense, regardless of whether your defense is actually getting stops in the redzone. However, if your defense is more prone to giving up explosive plays, then your offense will actually run relatively more plays per game (think Kliff Kingsbury Texas Tech). Though I still believe this visualization is very informative and digestible, it’s important to be aware that there’s some nuance it doesn’t capture.
Offensive tempo, while not as prevalent as it used to be, still results in a lot of inflated statistics. While there is some credit due for averaging a respectable number of yards per play at a high volume, it’s important to understand that offensive efficacy is much better measured on down-to-down efficiency, rather than total yardage. The truly elite offenses in college football are those who are able to inflict more damage on fewer opportunities, not those who manage to accumulate yards/points by having 10-20% more chances. On that note:
Pace Over the Last Decade
Something that has been quite apparent to fans of college football for the last ten years is how offenses have gradually changed. It’s not hard to remember the days when the Big 12 was known for being a high-flying, no-defense league. Games frequently shot into the 40s and 50s, and it wasn’t uncommon to see eight or more total touchdowns by halftime. There are many reasons why this level of offensive output has declined (a lot of credit goes to Iowa State’s Jon Heacock for pioneering the “Flyover” defense3), but one large contributor is the decline in offensive tempo. This isn’t restricted to the Big 12 either, it’s just most obvious in this conference. Take a look at the same graph as above but for the 2014 season:

Using the same axes ranges on the graph above, it becomes clear how the horde of teams shifted to the right. Average plays per game increased by roughly three and what is most notable is that there were 11 teams with 80 or more plays per game. In 2023, there were no teams above this threshold.4
This data tangibly supports a narrative we’ve been hearing for a few years: defenses are currently ahead of offenses. For some teams, tempo is used as a change-up. For many others, they won’t even run tempo outside of two-minute situations. Currently, tempo has largely been relegated to just one tool in the offensive toolkit, a far cry from the days of Chip Kelly’s “Blur Offense” at Oregon and Art Briles’ up-tempo Veer and Shoot at Baylor. Nowadays, basing in tempo (known as the HUNH5 offense) just means your defense is going to get less rest when you go 3-and-out in 50 seconds.6
Because defenses have solved the HUNH spread offenses, there are effectively no P5 teams that major in it anymore. Compare the early 2010s to now: Art Briles’ Baylor, Chip Kelly’s Oregon, Kliff Kingsbury’s Texas Tech, Sonny Dykes’ Cal, Dana Holgorsen’s West Virginia; these were all teams that championed HUNH spread offense. Now? I suppose you could make cases for teams like Josh Heupel’s Tennessee, Lane Kiffin’s Ole Miss, and Jeff Lebby’s Mississippi State. However, these teams incorporate it to a lesser degree, and there are frankly no teams that run an offense which incorporates HUNH to the level of success of the 2010s.7
Styles of Play by Region
The graph above also tangibly supports another common truth we’ve accepted as college football fans: offensive styles differ greatly by region. The Big Ten and SEC were typically the old-school, “three yards and a cloud of dust” teams. Offenses in these conferences generally aimed to control the game and wear down their opponent via time of possession and timely third-down conversions. Meanwhile, the Big 12 would spread you out and go quickly, along with the Pac-12 to a lesser extent. The ACC, while being a pretty slow conference in 2014, was not as archaic in structure as the Big Ten and SEC, using more spread sets.8
This has clearly changed in the ten seasons between 2014 and 2023. Quarterbacks and receivers in the SEC started putting up gaudy stats, some (definitely not all) Big Ten teams have opened up their offenses, and the Big 12 has become known for great halfback play, and to a degree, offenses that ran through their halfbacks.9
While pace certainly doesn’t capture all offensive changes, it is interesting to compare plays per game by conference in 2014 vs. 2023:

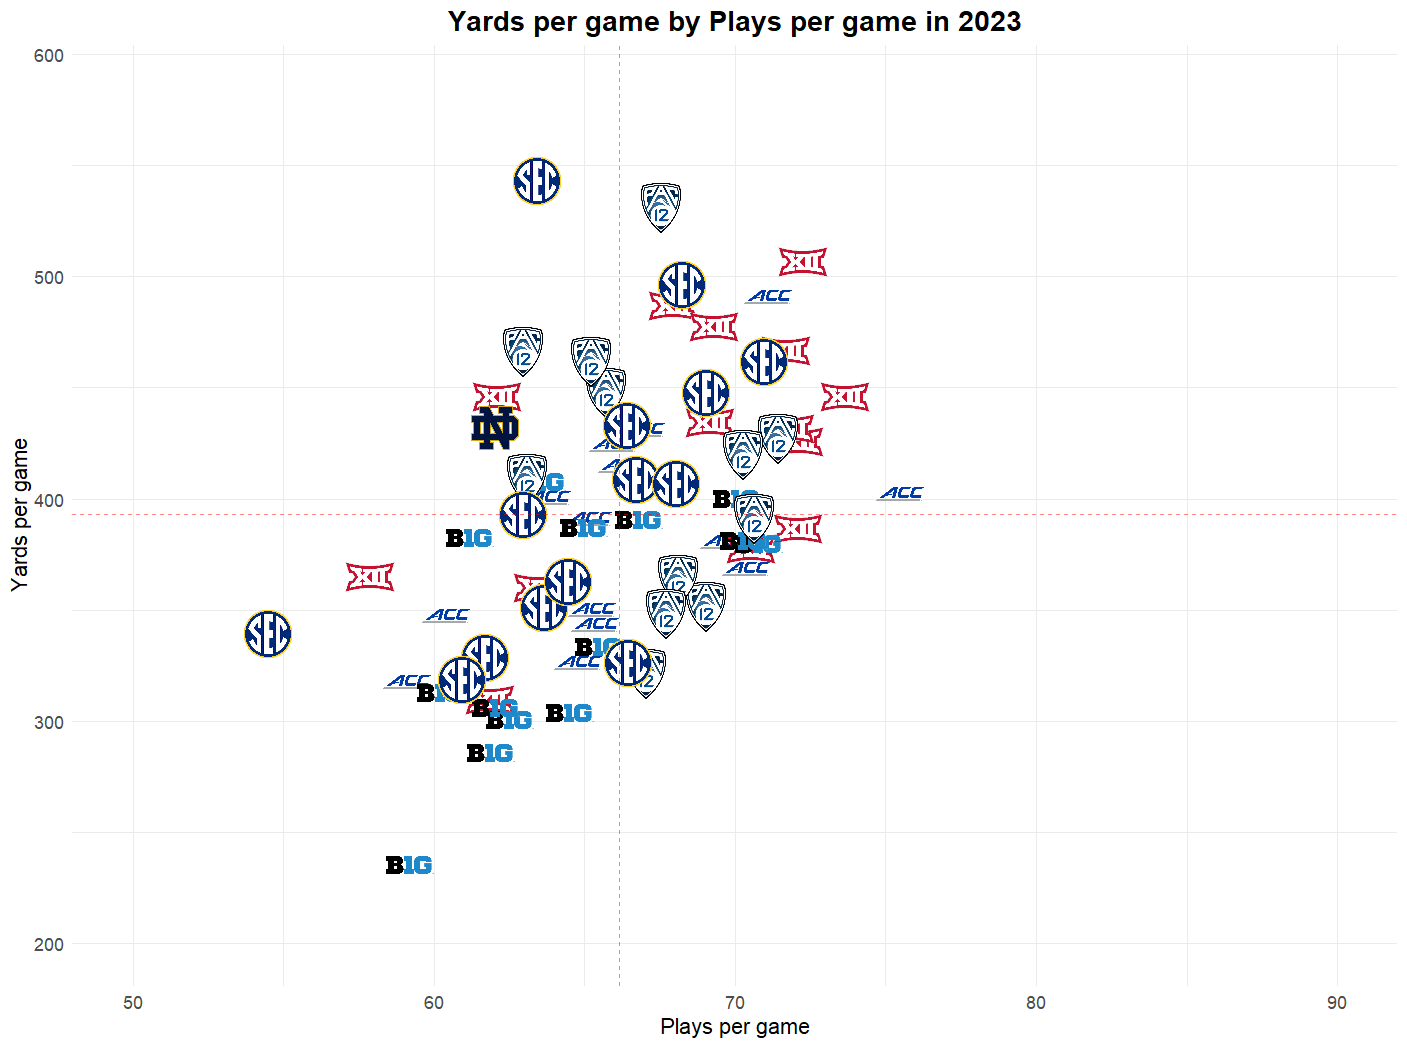
Interestingly, the nearly the same proportion of Big 12 teams operated above the median plays per game in both 2014 (6/10) and 2023 (10/14). Relative to the rest of the sport, from a pace standpoint, they actually didn’t change what they were doing. The key word is relative. As previously mentioned, the sport as a whole slowed down throughout this period.
Further, in 2023, only one more SEC team averaged more plays per game than the average team than the SEC’s count in 2014. The argument could be very easily made that it’s actually equal, depending on how you count Kentucky, who, in 2014, was 0.008 plays per game under the median. I counted them under, given that’s what the math says, but it’s splitting hairs at that point.
The Big Ten slowed things down throughout these ten years, starting with 43% of teams running more plays per game in 2014 than the average team compared to just 29% in 2023. More interestingly, there were only two teams gaining more yards per game than the average in 2023. Unsurprisingly, Ohio State is the only representative in the uber-efficient quadrant. The Big Ten’s reputation as an archaic offensive conference is well-earned.
Both the ACC and Pac-12 exhibited minor changes in pace. The ACC went from 43% of teams running more plays per game to 29%, like the Big Ten; the difference in 2023 being that the ACC had high-YPP teams while the Big Ten did not. The Pac-12 remained identical in this metric between 2014 and 2023. However, the Pac-12 went from the most variable conference in pace in 2014 to the least variable conference in 2023 (by a wide margin, too). Here’s the data in table format:
| (2014) Conference | Average plays/game | Standard Dev. plays/game |
| ACC | 70.84 | 4.94 |
| Big Ten | 70.05 | 5.23 |
| Big 12 | 76.46 | 6.56 |
| Pac-12 | 75.41 | 6.57 |
| SEC | 71.24 | 3.68 |
| (2023) Conference | Average plays/game | Standard Dev. plays/game |
| ACC | 66.36 | 4.09 |
| Big Ten | 64.49 | 3.64 |
| Big 12 | 68.25 | 4.75 |
| Pac-12 | 67.37 | 2.65 |
| SEC | 64.79 | 4.00 |
Some macro takeaways: while the structures/schemes of the offenses by conference have certainly changed (this is clear just by watching, particularly in the SEC and Big 12), the speed at which each individual conference operated, relative to the rest of the Power Five, largely did not change. The conferences still, to a degree, held the same pace identity in 2023 as they did in 2014, if you account for where the sport was at the time. In 2023, the Big 12 was still going faster than the SEC, the Pac-12 was just behind the Big 12, and the Big Ten was still largely stuck in the 1960s.
As for some key differences, it’s notable that the SEC went from last in variability to middle-of-the-pack. This supports the notion that some teams in the conference have “opened it up”, even though the conference’s average plays per game went down (again, a function of where offensive football was in 2023). Additionally, the ACC went from being the second least variable conference, to the second most variable, while their measure of variability actually decreased by ~23%. This supports the idea that college offenses as a whole have become much more similar in terms of plays per game. This is easy to see both on the graphs and in the tables. Regarding variance, every single Power Five conference in 2023 would be below the second-to-last conference in 2014. Another interesting point, the fastest conference in 2023 would be the slowest conference in 2014.
All of this means that while the conferences largely retained their offensive identities throughout these ten years10, offense as a whole has undoubtedly changed.
- I say “sort of” because there’s still a large range within each quadrant and acting like Iowa and Ole Miss are equal down-to-down is disingenuous at best. ↩︎
- Two Heisman winners and a runner-up! ↩︎
- Iowa State debuted the 3-deep safety look as a standard downs defense around 2017, and it was quickly picked up by the rest of the Big 12. ↩︎
- In 2023, the NCAA removed the clock stoppage on first downs, resulting in just under two less plays per game, comparing data from 2021-22 to 2023-24. This wasn’t a huge factor in the decrease in plays/game, but it played a role. ↩︎
- Hurry-up, no-huddle. ↩︎
- I recognize this is an extreme – but prior to defenses solving the spread + up-tempo offenses, this was less of an issue. ↩︎
- Some last-minute research led me to North Texas’ 2024 offense, which operates at a smoldering 19.9 seconds between plays. They rank in the top percentile of time between plays (1st), but are in the 93rd percentile for plays per game (9th), meaning some teams running plays at a slower pace are actually doing it more effectively (resulting in more plays/game). UNT’s 6-6 record and playing the 3rd most defensive snaps support this. Basically, they’re putting their defense back on the field faster/more often than they should. It appears that going this fast was actually detrimental to their team success. Fastest operating time ideally = most plays per game. ↩︎
- This is the one conference for which I just cannot determine an offensive identity. I thought I had them pegged as a wide-variance HUNH conference like the Pac-12, but the data suggests otherwise, in multiple ways. Complete enigma. ↩︎
- Breece Hall, Chuba Hubbard, Bijan Robinson, Deuce Vaughn, Cam Skattebo, David Montgomery, etc. ↩︎
- After the latest round of conference realignment, this has basically gone out the window. This article is only referring to the conference identities between the realignment periods of 2014 and 2023. ↩︎

Leave a comment