Updates / Notes
Given this is the first results post with neutral sites included, the formatting will be slightly different moving forward.
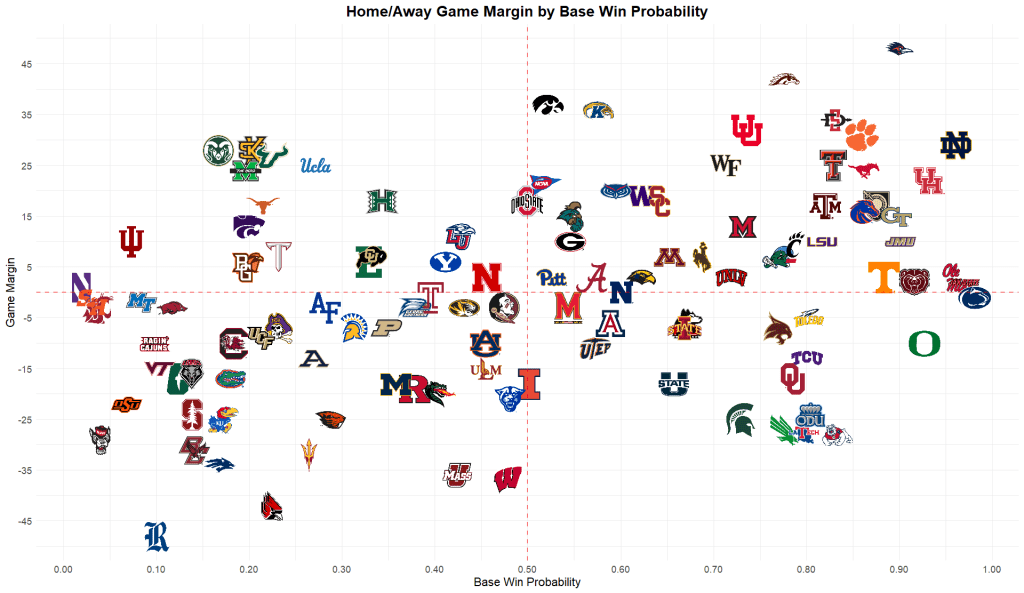
In addition, the visualization above includes games from the neutral site model. While this breaks a standard convention of not including data points from different models within the same visualization, it is necessary to do so based on how the models are built.
This post also debuts the “biggest nailbiters” section: games in which a team with >= 80% win probability wins by <= 10.
Lastly, this was mentioned in this week’s predictions post, but since I am now using two models (home/away and neutral site), the naming convention for base/slimmed has been changed from base/slimmed models to base/slimmed versions in an effort to ensure clarity. Effectively, base and slimmed are versions of the same overall model
Week 7 Statistics
Home/Away Model:
- Base Version Record: 37-17
- Base Version Accuracy: 68.52%
– - Slimmed Version Record: 37-17
- Slimmed Version Accuracy: 68.52%
– - Agree-Disagree Between Versions: 52-21
- Disagreement Percentage: 3.70%
Neutral Site Model:
- Base Version Record: 1-1
- Base Version Accuracy: 50.00%
– - Slimmed Version Record: 2-0
- Slimmed Version Accuracy: 100.00%
– - Agree-Disagree Between Versions: 1-1
- Disagreement Percentage: 50.00%
Combined:
- Base Version Record: 38-18
- Base Version Accuracy: 67.86%
– - Slimmed Version Record: 39-17
- Slimmed Version Accuracy: 69.64%
– - Agree-Disagree Between Versions: 53-3
- Disagreement Percentage: 5.36%
Notable Predictions
Texas over #6 Oklahoma (52.30% base, 21.49% slimmed)2
#23 USC over #15 Michigan (64.23% base, 55.75% slimmed)
Pitt over #25 Florida State (52.54% base, 50.54% slimmed)
Most Unlikely Outcomes
#7 Indiana over #3 Oregon (7.29% base, 8.64% slimmed)3
Northwestern over Penn State (1.92% base, 3.00% slimmed)
UCLA over Michigan State (27.15 base, 26.90% slimmed)
Kansas State over TCU (19.96% base, 18.37% slimmed)
Biggest Nailbiters
#4 Ole Miss vs. Washington State; 24-21 (Ole Miss Win: 96.31% base, 96.38% slimmed)
#12 Tennessee vs. Arkansas; 34-31 (Tennessee Win: 88.32% base, 87.58% slimmed)
#11 LSU vs. South Carolina; 20-10 (LSU Win: 81.74% base, 76.07% slimmed)
Running Totals
Home/Away Model:
- Base Version Record: 108-45
- Base Version Accuracy: 70.59%
– - Slimmed Version Record: 107-47
- Slimmed Version Accuracy: 69.48%
– - Agree-Disagree Between Versions: 147-6
- Disagreement Percentage: 3.92%
Neutral Site Model:
- Base Version Record: 1-1
- Base Version Accuracy: 50.00%
– - Slimmed Version Record: 2-0
- Slimmed Version Accuracy: 100.00%
– - Agree-Disagree Between Versions: 1-1
- Disagreement Percentage: 50.00%
Combined:
- Base Version Record: 109-46
- Base Version Accuracy: 70.32%
– - Slimmed Version Record: 109-47
- Slimmed Version Accuracy: 69.87%
– - Agree-Disagree Between Versions: 148-7
- Disagreement Percentage: 4.52%
Full Breakdown of Results
Given that the Personal Plan in WordPress doesn’t allow for plugins to be installed, I can’t embed data tables into these pages without running into a ton of formatting issues.
To see the full breakdown of results, please follow the Google Drive link to the Excel document below:
- The version split on two different games, hence the same overall record for the week ↩︎
- Because the neutral site model is trained on significantly less games than the home/away model, the base and slimmed versions show much more variance. ↩︎
- Advanced metrics really, really do not like Indiana for some reason. ↩︎

Leave a comment